The USDA Plant Hardiness Zone Map was recently updated after more than a decade. It confirms what anyone who’s planted seeds recently already knows.
X
The USDA Plant Hardiness Zone Map was recently updated after more than a decade. It confirms what anyone who’s planted seeds recently already knows.
January 29, 2024
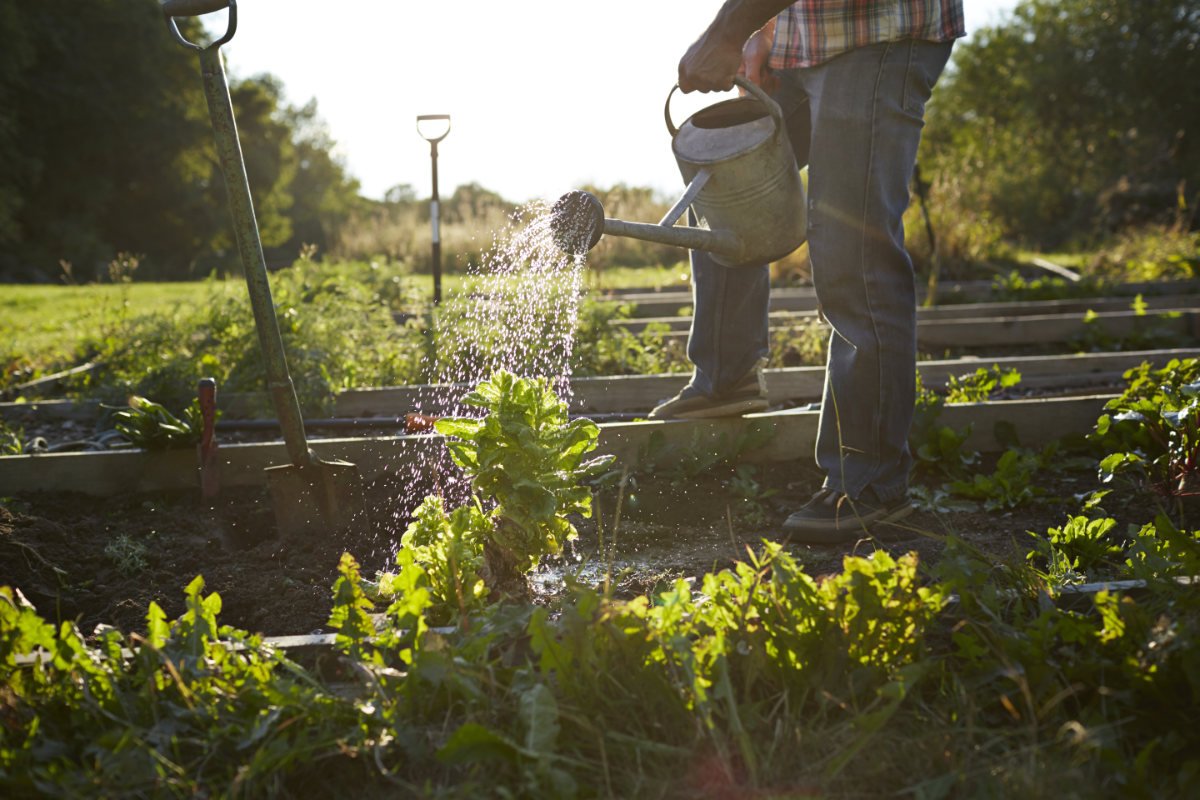
Tim Kohlhauff remembers the days when his hometown of Spokane, Washington was in zone 5b on the Plant Hardiness Zone Map. When he was growing up, daisies, rhododendrons, and azaleas were always teetering on the edge of viability, the winter conditions often just a bit too chilly for their liking. But all that has changed in recent decades, says Kohlhauff, a Master Gardener and a Horticulture Coordinator at Washington State University. “Now we’re not nearly as cold.”
Science is confirming the experiences of Kohlhauff and many other gardeners: The most recent version of the Plant Hardiness Zone Map reflects warmer conditions across a wide swath of the United States. Today, Spokane is designated zone 7a. That’s an enormous shift, says Kohlhauff. “In my lifetime, my town has gone up two zones.”
On the one hand, it’s reassuring to see scientific observations backing up gardeners’ anecdotal observations, says Kohlhauff. But it’s also somewhat unnerving to realize just how much things are changing, he says. “It’s a little bit jarring.”
The USDA Plant Hardiness Zone Map is a familiar sight to most gardeners. The brightly colored map, which can be found on the back of many seed packets, is intended to provide guidance for selecting the perennial plants that are most likely to do well in a gardener’s distinct climatic zone. “You can think of the Plant Hardiness Zone Map as a plant selection and risk management guide,” says Chris Daly, a geospatial climatologist at Oregon State University in Corvallis and a key contributor to the map.
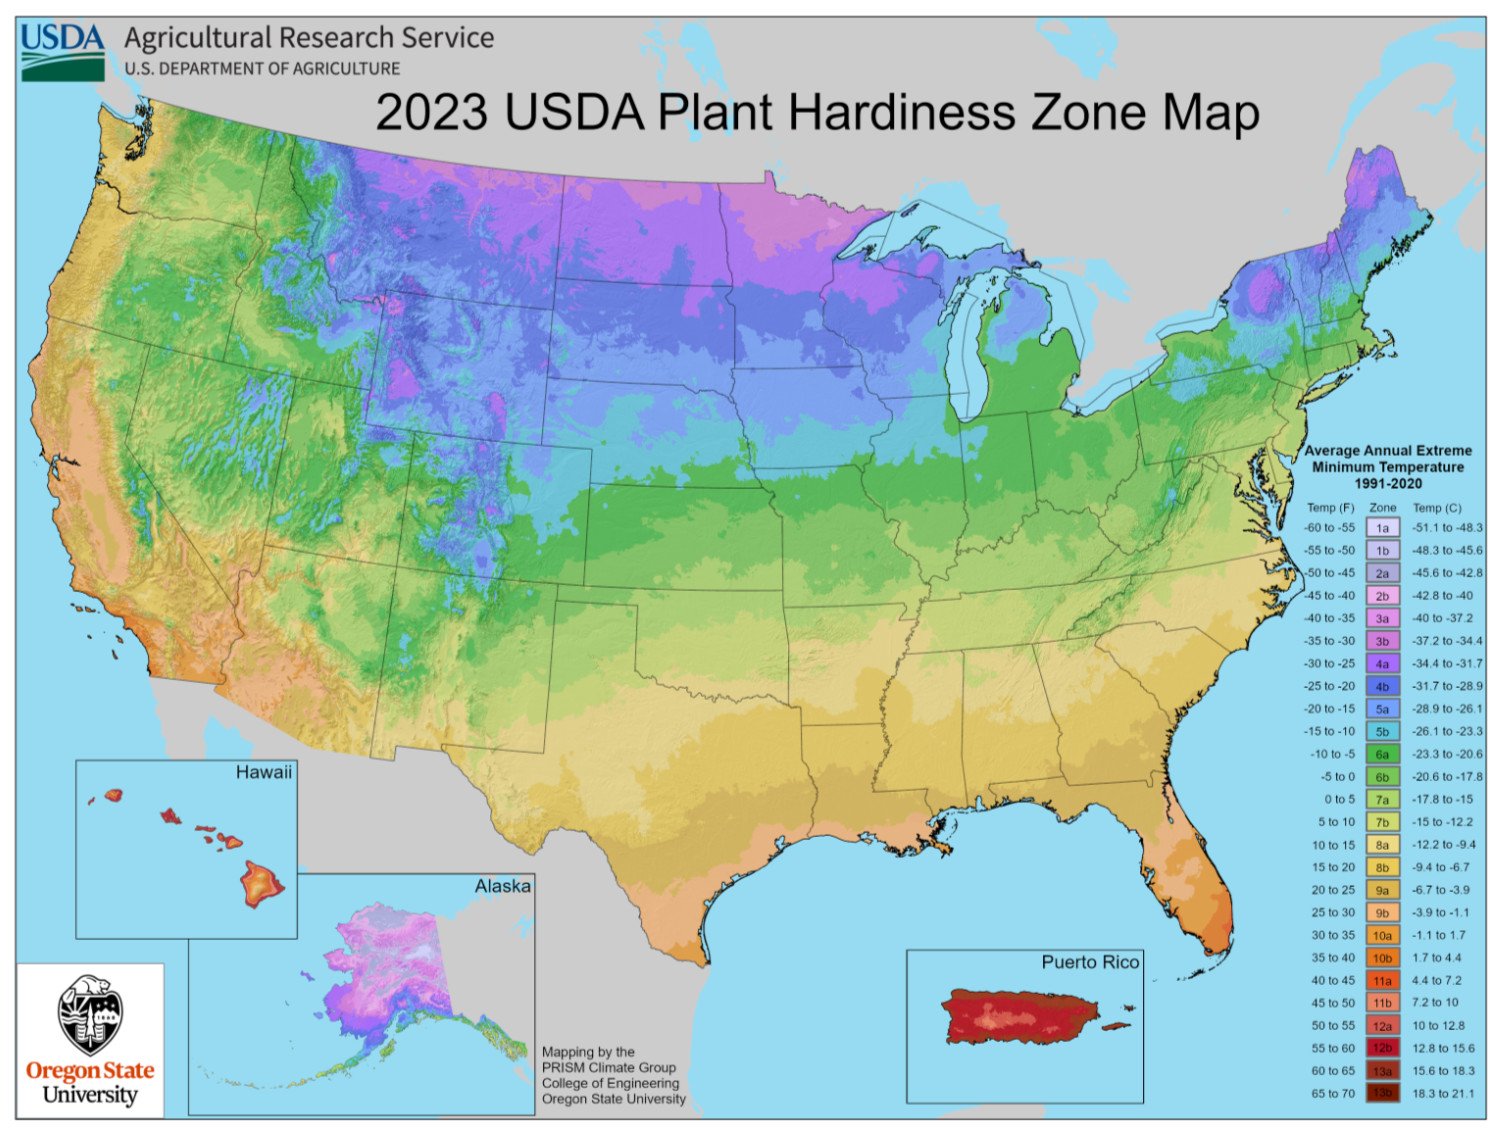
The 2023 USDA Plant Hardiness Zone Map.
Last November, the USDA released the 2023 version of the map. Compared with earlier iterations, the most recent version incorporates data from significantly more weather stations and provides a more granular look at conditions across the United States and Puerto Rico. Relative to its predecessor, which was published in 2012, the new map is overall about one quarter-zone warmer, on average.
And while the USDA is reticent to attribute those shifts to climate change, it’s undeniable that the globe is warming—2023 was the hottest year in recorded history—and that extreme weather is becoming more commonplace.
Civil Eats recently spoke with scientists, gardeners, and horticultural industry experts across the country about the history of the map, what the changes really mean, and how the new zones reflect shifting conditions on the ground.
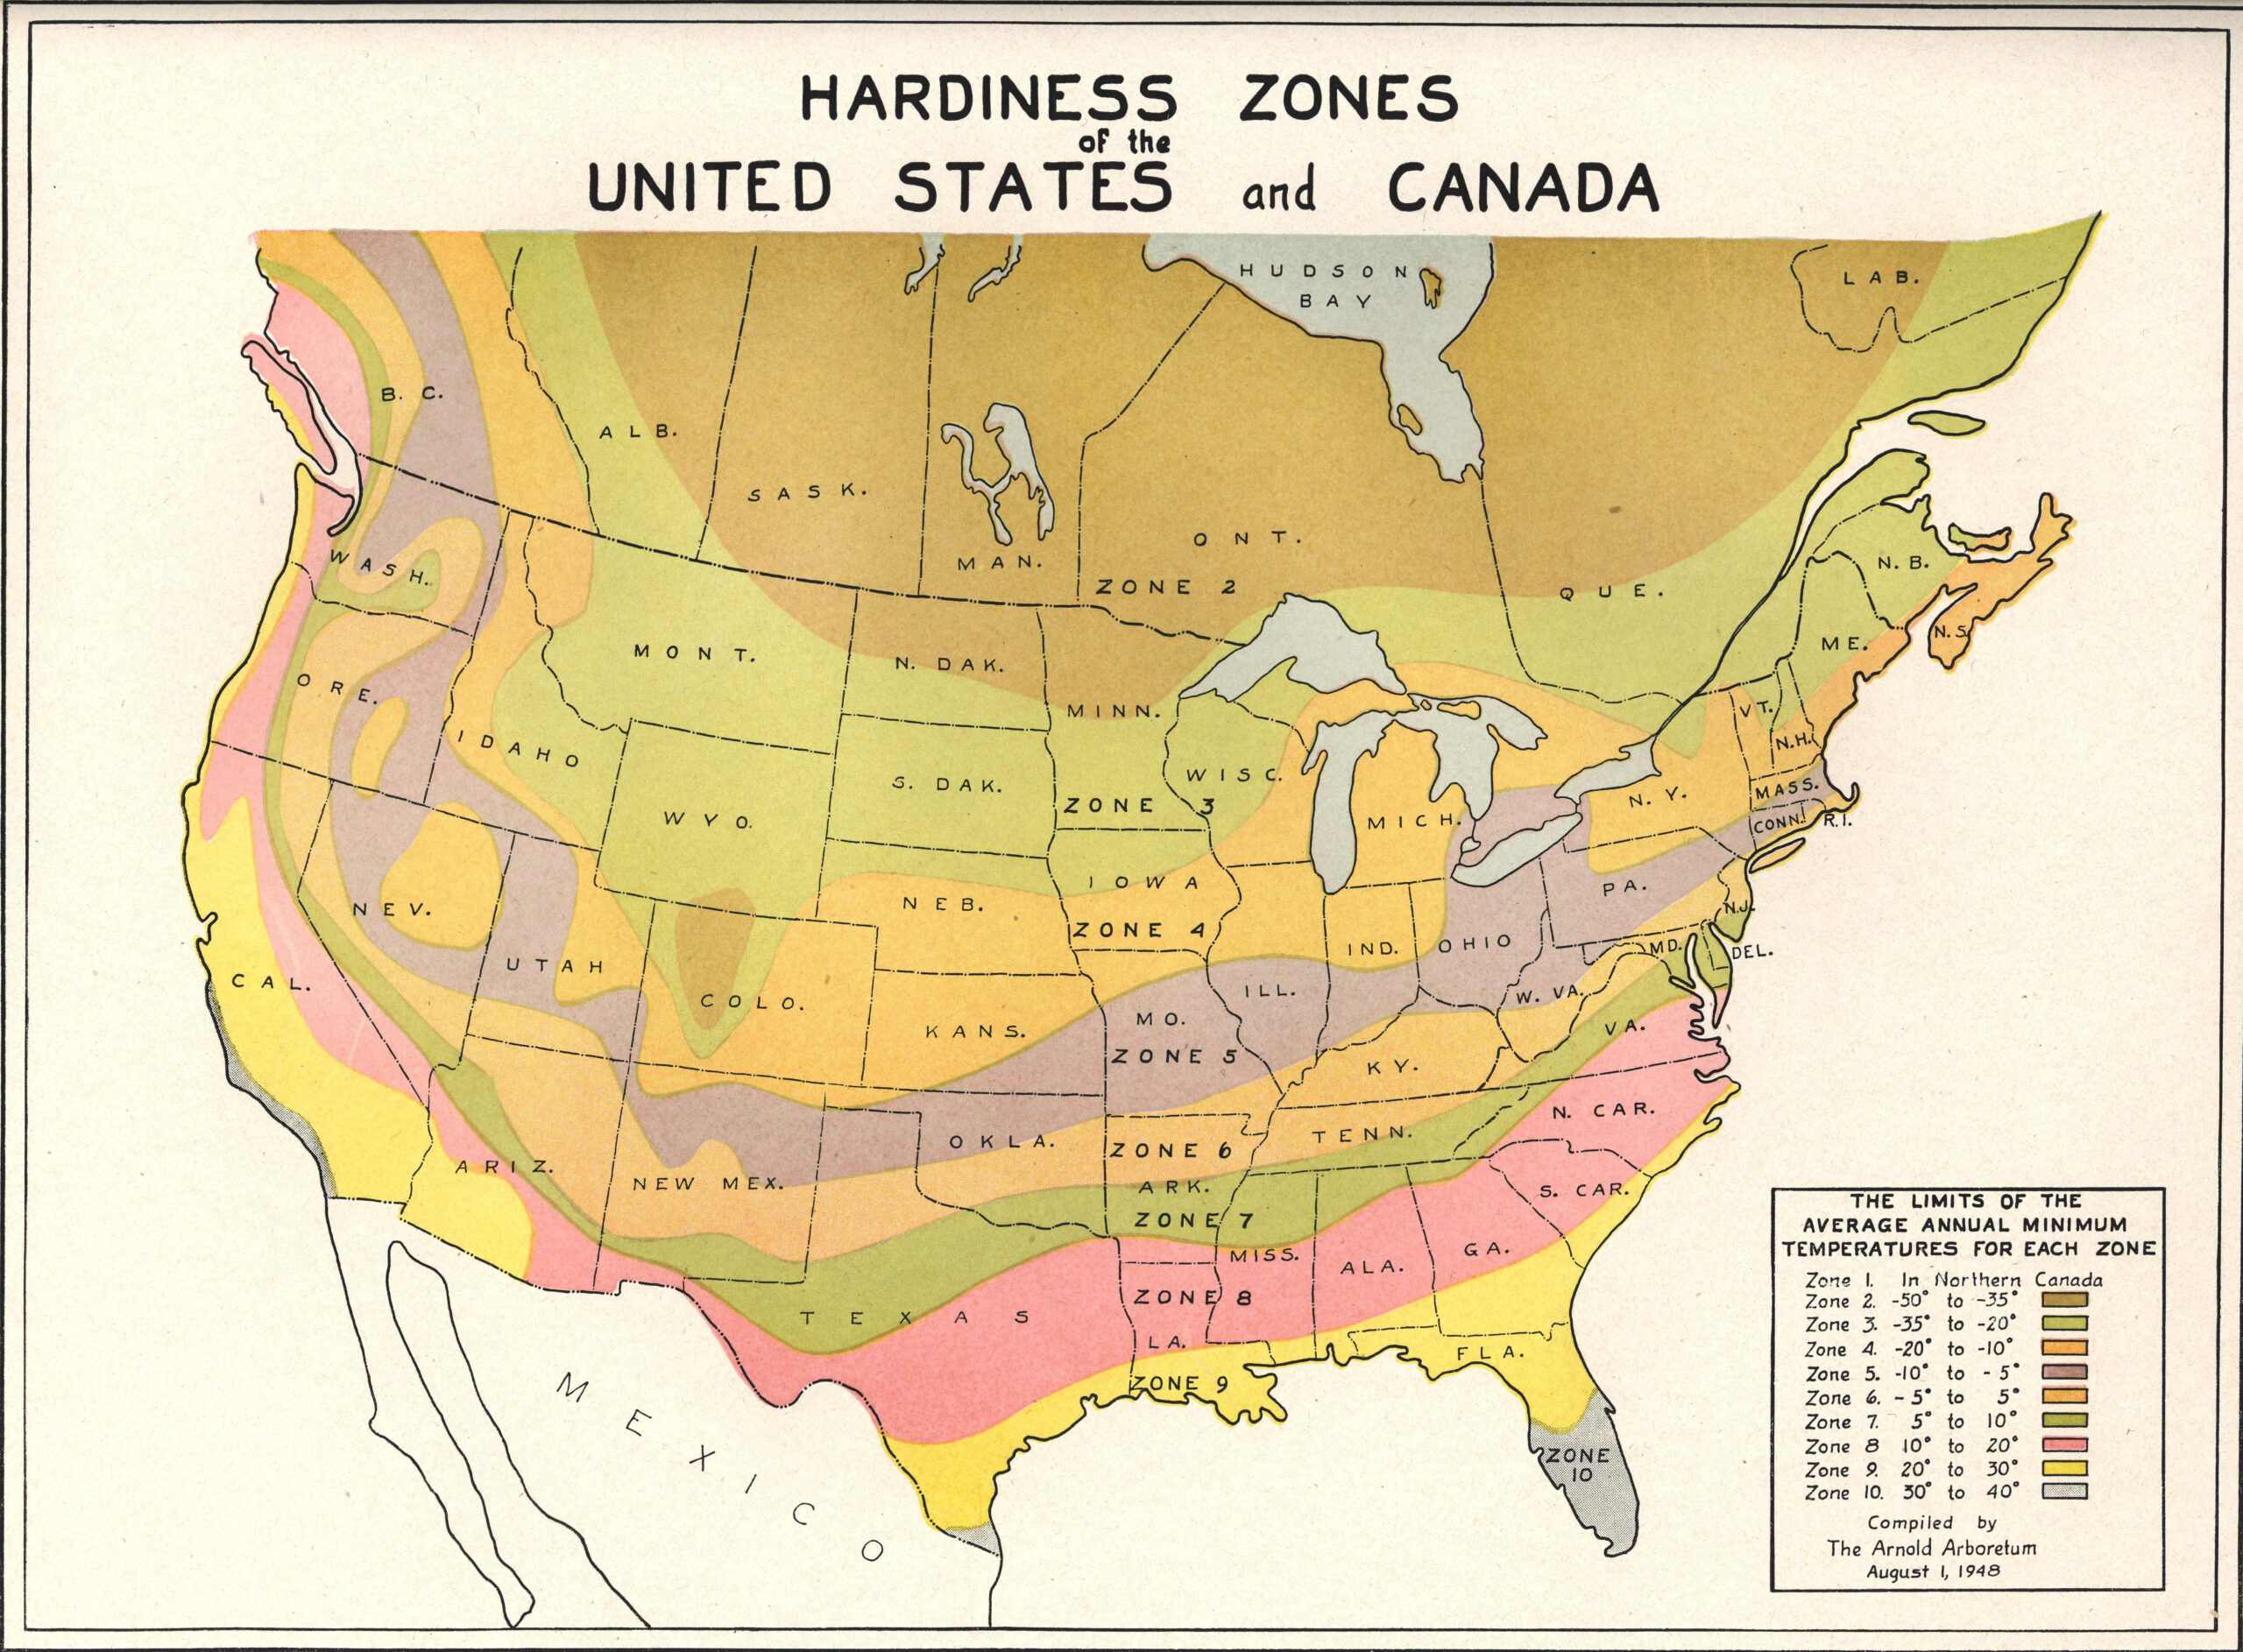
Plant hardiness maps have a colorful past. By the middle of the 20th century, institutions such as Harvard University’s Arnold Arboretum were publishing hand-drawn maps of the U.S. covered with swirling bands of green, yellow, and pink. Each contour traced what’s known as an isotherm, a region of roughly constant temperature. The maps divided the country into a handful of numbered zones according to wintertime temperature lows.
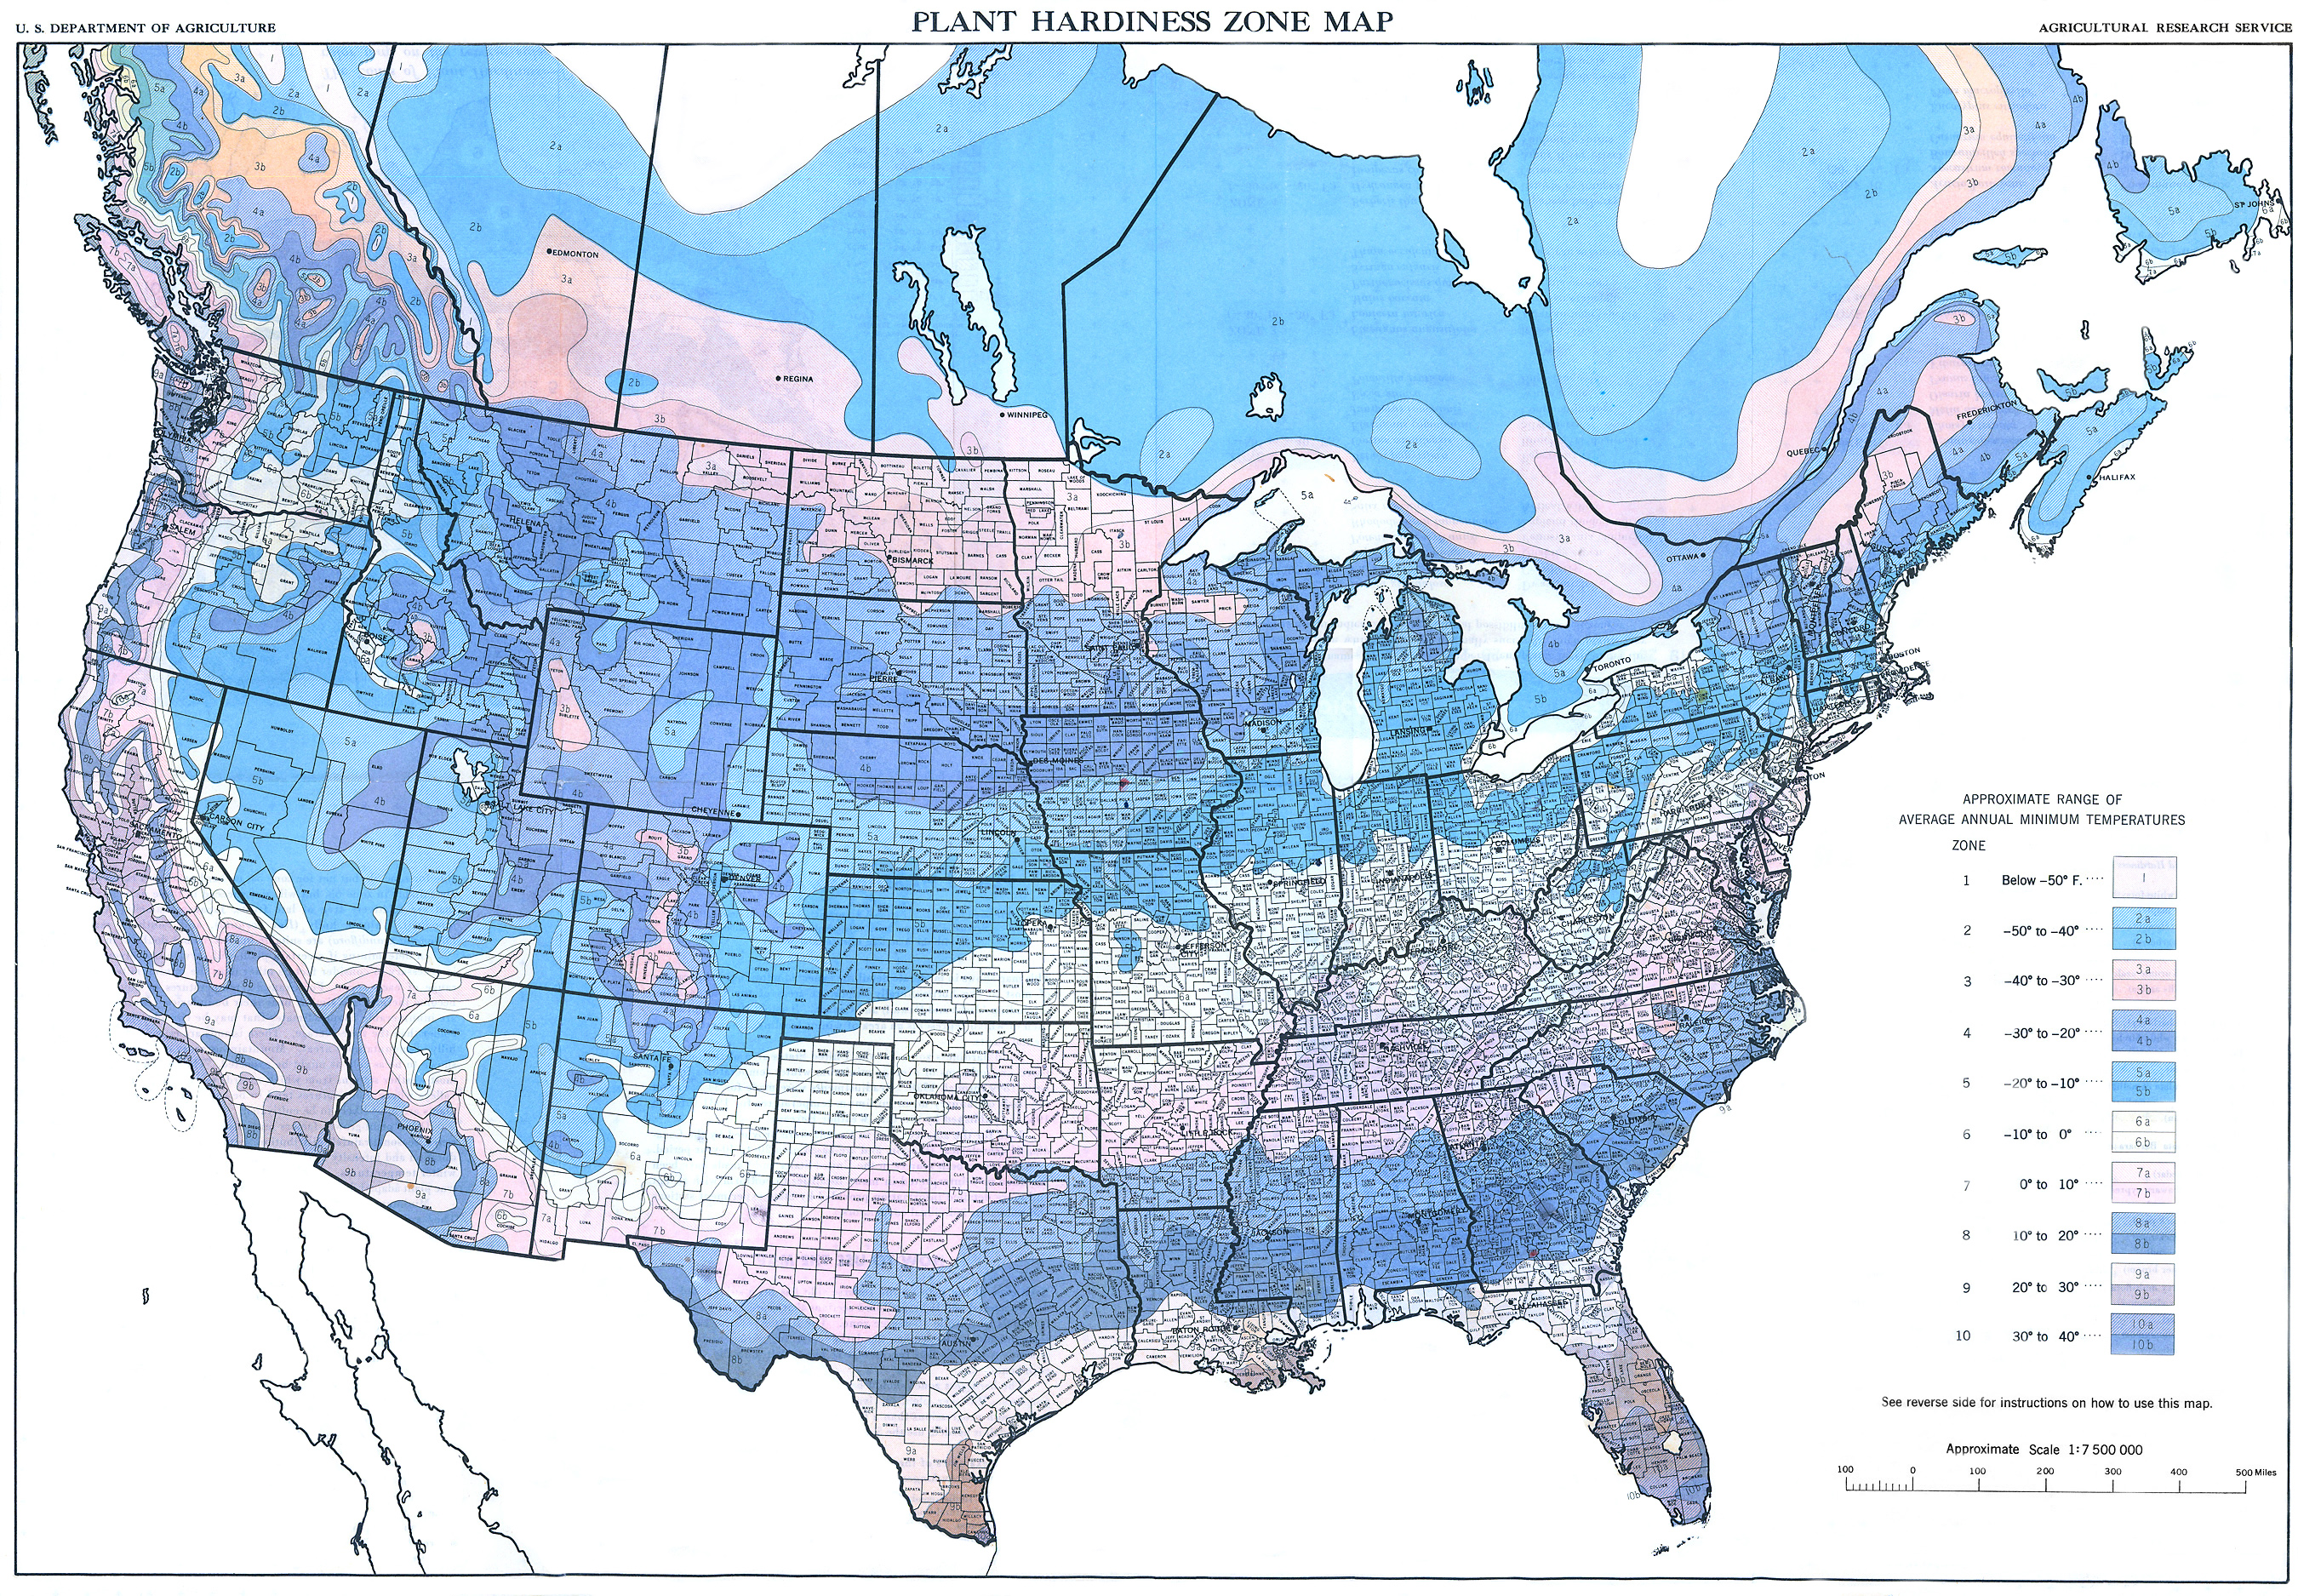
But the zones of many of those early maps weren’t consistent in their temperature intervals—one zone might span 7 degrees while an adjacent one spanned 15 degrees, for instance. With the aim of providing a more standardized and easily-interpretable map, the USDA released its own Plant Hardiness Zone Map in 1960. That map, based on data collected from a few hundred weather stations spread across the country, featured 10 zones.
Each encompassed a 10-degree span of average wintertime lows ranging from below -50 degrees Fahrenheit to 40 degrees Fahrenheit. Zones 2–10 were further subdivided into two 5-degree half zones termed “a” and “b.” Others, like the Arbor Day Foundation and Sunset, have since published their own plant hardiness maps, but the USDA Plant Hardiness Zone Map is arguably gardeners’ go-to resource.
The USDA map has been updated four times since 1960. A version released in 1990 introduced a new warmer zone, zone 11. But that map was based on only 13 years of weather data (1974–1986), and it just so happened that a cold spell afflicted much of the eastern U.S. during that period. “That map came out fairly cool,” says Daly.
The next update to the map, published in 2012, saw the addition of two new zones, zones 12 and 13. The map also included Puerto Rico for the first time. It furthermore incorporated three decades’ worth of weather data (1976–2005). That’s a long enough span to begin to ensure robust analyses, says Daly. “You need at least 30 years of data to really start creating what I call a solid statistical average.”
The newest version of the map, released last November, is also based on three decades’ worth of data (1991–2020). And for the first time, the map is aligned with an interval of time known as a “climate normal.” That consistency is important for fairly comparing the USDA Plant Hardiness Zone Map with other weather-related records. “I really wanted to align this map with that 30-year normal period,” says Daly, who was involved in the creation of both the 2012 and 2023 maps.
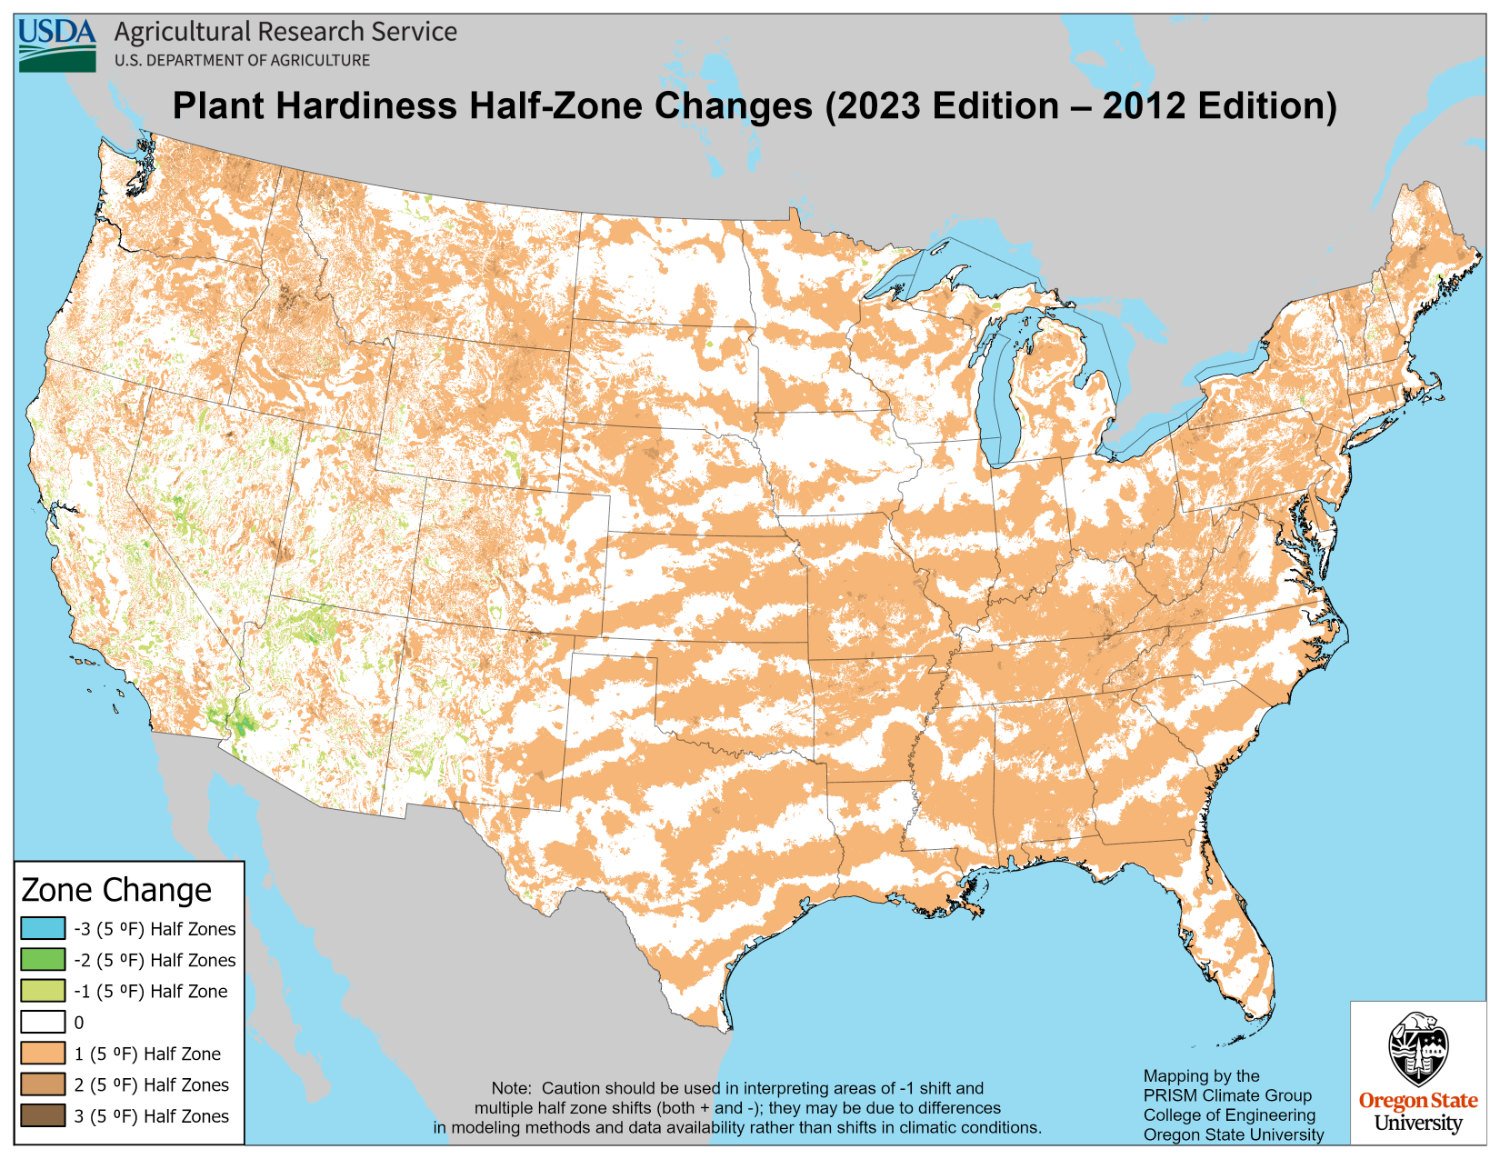
A map showing the shift in map zones across the U.S. Darker brown colors represent a greater amount of warming; only small portions of the West and Southwest show any cooling.
The data that went into the newest version of the map derived from over 13,000 weather stations spread across the U.S. and Puerto Rico. That’s a roughly 70 percent increase over the number of stations that informed the 2012 map. However, the entire map is made up of tens of millions of roughly ½-mile-by-½-mile grid cells, so it was necessary to interpolate the conditions between weather stations. That’s where Daly and his team came in.
The researchers took into account not only the distance between each grid cell and nearby weather stations but also the local terrain—for example, elevation and proximity to water. That’s important because temperature tends to decrease with elevation, and conditions are often milder near large bodies of water, says Daly.
The 2023 map is, on average, about 2.5 degrees Fahrenheit warmer than the 2012 map. Roughly half of the grid cells shifted a half zone warmer, and the remaining grid cells didn’t change zone.
Despite a reluctance on the part of the USDA to pin the changes in the map on climate change, it’s telling that a significant fraction of the measurements for the new map all shifted towards warmer conditions, says Daly. “The fact that it’s so widespread, we can probably know that it’s real.”
As weather patterns continue to shift, however, one big question is how valuable the Plant Hardiness Zone Map will remain over time. That’s difficult to say, admits Daly, in part because the plant hardiness statistic is changing at different rates across the country. But in some ways it’s heartening that the shifts between the 2012 and 2023 maps were relatively small. “The average change was only a quarter of a zone, which is not earth shaking,” says Daly. “It’s a fairly small change overall.”
It’ll be important to keep updating the map to keep it current, says Daly. “There’s a lot of interest in trying to come up with a regular schedule.” It’d be ideal to redo the map every decade to align with the new climate normal period. But turning that interest into reality isn’t as easy as it sounds. “That has to do with the vagaries of funding and administrations,” he adds.
Home gardeners across the country have been noting changes for years, and the new Plant Hardiness Zone Map validates their lived experiences. “It matches what I’m experiencing,” says Kohlhauff. “It’s also proof that what I see happening—warmer winters, hotter summers—is not just my anecdotal observations.”
Ashley Wiita, a master gardener who works for Territorial Seed Company, echoes that sentiment. “There has already been an increase in customers reaching out to ask for guidance or suggestions because a crop they grew for years is no longer doing well in their area,” she says. “I’ve had customers who are used to slightly cooler and wetter weather conditions looking for more heat- and drought-tolerant options as they work to adapt to conditions outside of their normal experiences.”
The changes in the Plant Hardiness Zone Map only represent a small portion of the total number of shifts that gardeners are experiencing. It doesn’t take into account, for instance, heat waves, droughts, invasive species, or extreme rainfall, all of which have been increasing in frequency as the climate changes.
Plant hardiness zones should therefore be thought of as just one tool in a gardener’s proverbial toolkit, says Wiita. There’s so much more to determining whether a particular plant will thrive in someone’s yard, she says. “We try to consider the specific growing conditions in their area, rather than going off the hardiness zone alone. Zone 8 in the Pacific Northwest can look drastically different than zone 8 in Texas.”
What’s a gardener to do? Scott Wilson, a master gardener based in Colorado Springs, suggests that growers experiencing changing conditions might do well learning more about microclimates. Even within a small urban yard, certain areas can be cooler or warmer than surrounding regions because they’re exposed to more wind, for example, or because they receive heat re-radiated from nearby structures, says Wilson.
Those hyperlocal differences can be exploited to a gardener’s advantage, he says. “You might be able to choose plants that would not normally survive in your own zone.”
And perhaps the best advice is the simplest. “Each gardener really needs to learn their own weather patterns,” says Wilson. “Their garden is unique.”

October 9, 2024
In this week’s Field Report, MAHA lands on Capitol Hill, climate-friendly farm funding, and more.
October 2, 2024

October 2, 2024
October 1, 2024
September 24, 2024
September 18, 2024


Like the story?
Join the conversation.